
A data annotation assessment is not just about checking for mistakes. It is a systematic process for evaluating the quality, accuracy, and consistency of the labeled datasets used to train your AI models. Think of it as moving beyond simple error checking to building a strategic framework that guarantees your AI learns from reliable, precise information.
Why Data Annotation Assessment Is Your AI's Foundation
Imagine building a skyscraper. If the foundation has even the smallest cracks or inconsistencies, the entire structure is at risk. Your annotated dataset is that foundation for your AI. The quality of your training data directly dictates how well your final model performs, how reliable it is, and ultimately, how safe it is to use.
A robust data annotation assessment is not just a quality check; it is a critical, strategic process for any company building dependable AI.

Without a formal assessment process, you are flying blind. You risk pouring massive resources into training a model on flawed data, which always leads to poor outcomes. The stakes are huge: costly model failures, major project delays, and a loss of user trust. For example, an e-commerce recommendation engine trained on inconsistently tagged products will start suggesting irrelevant items, directly hurting sales and customer loyalty.
The Core Pillars of a Strong Assessment Strategy
To head off these problems, a strong assessment strategy needs to stand on three core pillars. These principles work together, creating a solid framework for validating the "language" your AI is learning. They make quality a measurable, repeatable goal.
A successful data annotation assessment framework always focuses on:
- Accuracy: Does each label correctly reflect the ground truth according to your project guidelines? This is the absolute baseline of quality.
- Consistency: Are different annotators labeling the same data in the same way? Is a single annotator consistent over time? This covers both inter-annotator and intra-annotator agreement.
- Completeness: Have all the required objects or attributes in the data been labeled? Is anything missing?
This structured approach turns quality from a vague idea into an actionable roadmap. It is the only way to build trustworthy AI from the ground up, making sure your model’s decisions are based on verified, high-quality information.
The demand for this level of rigor is exploding. The global data annotation tools market is projected to hit USD 96.13 billion by 2035, and it is driven by the need for datasets with over 95% labeling precision to avoid expensive deployment errors. With poor data quality causing an estimated 80% of AI project failures, a systematic assessment is non-negotiable.
By proactively assessing your data quality, you are not just catching errors; you are investing in the long-term reliability and success of your entire AI initiative. It is the difference between building an AI system that merely functions and one that consistently delivers exceptional value.
Ultimately, this foundational work is what allows you to scale. Services that focus on precise data tagging build this quality assurance directly into their workflows. This creates a repeatable process that can support even the most complex AI systems as they grow.
Building Your Assessment Framework and KPIs
Moving from theory to practice means you need a clear blueprint. A solid data annotation assessment framework is not built on vague goals like "high quality." It is built on specific, measurable targets you define before a single data point gets labeled.
Getting this step right turns quality from an abstract idea into a concrete plan that drives predictable AI outcomes. It all starts by defining exactly what you want your AI model to do. Are you building an e-commerce model to slash product returns? Or a medical imaging AI that has to spot anomalies with near-perfect accuracy? Each goal demands a totally different approach to quality.
Once the objectives are crystal clear, you can set the Key Performance Indicators (KPIs) to measure your progress. Think of KPIs as the language you use to communicate quality standards across your entire team. Without them, you are just hoping for the best.
Defining Your Project-Specific KPIs
Generic metrics will not cut it. Your KPIs have to be shaped by the unique demands of your project. For a self-driving car’s object detection system, a high Intersection over Union (IoU) score for bounding boxes is non-negotiable. On the other hand, a sentiment analysis model for customer feedback would obsess over precision and recall for emotional tone labels.
To build meaningful KPIs, focus on these core areas:
- Accuracy Metrics: How close are the labels to the undisputed ground truth? This covers metrics like precision (how many positive labels were right) and recall (how many of all positive instances were actually labeled). For a security system flagging threats, high recall is everything; you cannot afford to miss a real danger.
- Consistency Metrics: How well do your annotators agree with each other? This is where Inter-Annotator Agreement (IAA), often measured with metrics like Cohen's Kappa, comes in. A high IAA score is a great sign that your guidelines are clear and your team is on the same page.
- Throughput Metrics: How much data is your team annotating in a given timeframe? While speed is important for scaling up, it can never come at the cost of accuracy. Tracking throughput helps you manage project timelines and know where your resources are going.
These KPIs become the dashboard for your data pipeline's health, giving you real-time insights. This data-first approach is the bedrock of any modern AI quality assurance process.
Below is a breakdown of essential KPIs you can adapt for your own assessment framework.
Key Performance Indicators for Data Annotation Assessment
This table outlines the essential KPIs for measuring annotation quality, complete with definitions and common target benchmarks. Use it as a starting point to build a dashboard that aligns with your specific project goals, whether you're working in healthcare, e-commerce, or autonomous systems.
| KPI Category | Metric | Description | Example Target Benchmark |
|---|---|---|---|
| Accuracy | Precision | The percentage of positive labels that were correctly identified. (TP / (TP + FP)) | >98% for medical imaging tumor detection. |
| Accuracy | Recall | The percentage of all actual positive instances that were correctly labeled. (TP / (TP + FN)) | >99% for critical safety systems (e.g., pedestrian detection). |
| Accuracy | F1-Score | The harmonic mean of Precision and Recall, providing a single score for accuracy. | >95% for general object classification. |
| Agreement | Inter-Annotator Agreement (IAA) | Measures the level of agreement between multiple annotators labeling the same data. | Cohen's Kappa >0.80 for complex semantic segmentation tasks. |
| Efficiency | Annotation Throughput | The number of data points (images, documents) annotated per annotator, per hour/day. | 150-200 images/day for standard bounding box tasks. |
| Quality Control | Adjudication Rate | The percentage of annotations that require review and correction by a senior reviewer due to disagreement or low confidence. | <5% for a mature, well-trained annotation team. |
| Quality Control | Error Rate | The percentage of annotations found to have errors during the QA process. | <2% for enterprise-grade production datasets. |
By tracking these metrics, you move beyond guesswork. You can pinpoint exactly where your process is strong and where it needs attention, ensuring every dollar spent on annotation delivers maximum value for your model.
Establishing the Gold Standard Document
The single most important tool you have for ensuring consistency and accuracy is your gold standard document, also known as your annotation guidelines. This is the ultimate source of truth for your project. It needs to detail every rule, edge case, and example, leaving absolutely no room for interpretation.
A well-crafted gold standard document is more than just a rulebook; it is a living contract between your project goals and your annotation team. It empowers annotators to make confident, consistent decisions, directly reducing errors and rework.
This document must be comprehensive and highly visual. Make sure it includes:
- Clear Definitions: Provide explicit definitions for every single label and attribute.
- Visual Examples: Show clear "do" and "don't" examples for both common and tricky scenarios.
- Edge Case Resolution: Document exactly how to handle rare or ambiguous situations that pop up.
- Version Control: Keep the document updated as new challenges arise and ensure everyone is always working from the latest version.
Imagine a geospatial AI project identifying building damage after a storm. The gold standard document would need to visually distinguish between "minor," "moderate," and "severe" damage with annotated images. Without this shared reference, one annotator's "moderate" could easily be another's "severe," poisoning the dataset with critical inconsistencies. This level of detail is a hallmark of high-performing data annotation services.
Building this framework takes serious effort upfront, but the payoff is huge. It creates a systematic, repeatable process that catches errors early, aligns your entire team, and builds a rock-solid foundation of trust for your AI model.
Implementing a Multi-Layered Quality Assurance Workflow
Checking for quality only at the end of a big annotation project is like inspecting a car after it has already rolled off the assembly line. You will find problems, but fixing them is expensive and slow. It is far better to build quality in at every single step. A multi-layered Quality Assurance (QA) workflow does exactly that, creating checkpoints to catch errors early, build confidence, and stop systemic issues before they can ruin your AI model.
This is not about a simple pass/fail grade. It is about creating a robust pipeline where data gets refined and validated at multiple stages. The goal is to make sure the final dataset is as clean and accurate as humanly possible, which is a cornerstone of any serious data annotation assessment.
The Power of Consensus and Blind Audits
The first layer is often a consensus review. Here’s how it works: the same task is sent to several annotators, all working independently. An automated system then compares their labels. If everyone agrees, the data moves on with a high degree of confidence.
But if there is a disagreement? That data point gets flagged for a closer look. This approach is fantastic for spotting ambiguous instructions or tricky edge cases that might trip up a single person. It replaces guesswork with solid, data-driven validation.
Another crucial layer is the blind audit. In this step, a senior reviewer or QA specialist checks a sample of labeled data without knowing who did the original work. This eliminates any potential bias and gives you an objective measure of quality against your gold standard.
A multi-layered QA process is not just about catching individual mistakes. It is about building a system that makes mistakes hard to make and easy to fix. Each layer acts as a filter, purifying the dataset before it ever touches your model.
This kind of systematic approach has a real, measurable impact. For example, in North America, where firms hold over 30% of the data annotation outsourcing market, double-blind assessments are proven to slash annotation errors by 22%.
Designing a Smart Sampling Strategy
Let’s be realistic: reviewing 100% of your annotated data is rarely practical, especially with massive datasets. That is where a smart sampling strategy comes in. You want to get a reliable snapshot of overall quality without having to inspect every single item.
Your sampling method should fit the project's needs:
- Random Sampling: This is where you pull a random percentage of the data, say, 10% of a batch, for review. It is a great way to get a broad, unbiased overview of quality and works well for mature projects where performance is already consistent.
- Targeted Sampling: This method is more like surgery. It focuses on areas you already know are difficult. You might target work from new annotators, specific edge cases that have caused trouble before, or label classes that historically have higher error rates.
The best approach often blends the two. You can start with a baseline random sample and then use targeted sampling to dig deeper into any issues that pop up. This ensures your review efforts are focused where they will make the biggest difference.
As the diagram below shows, any good assessment framework, including your QA and sampling workflows, starts with clear goals.
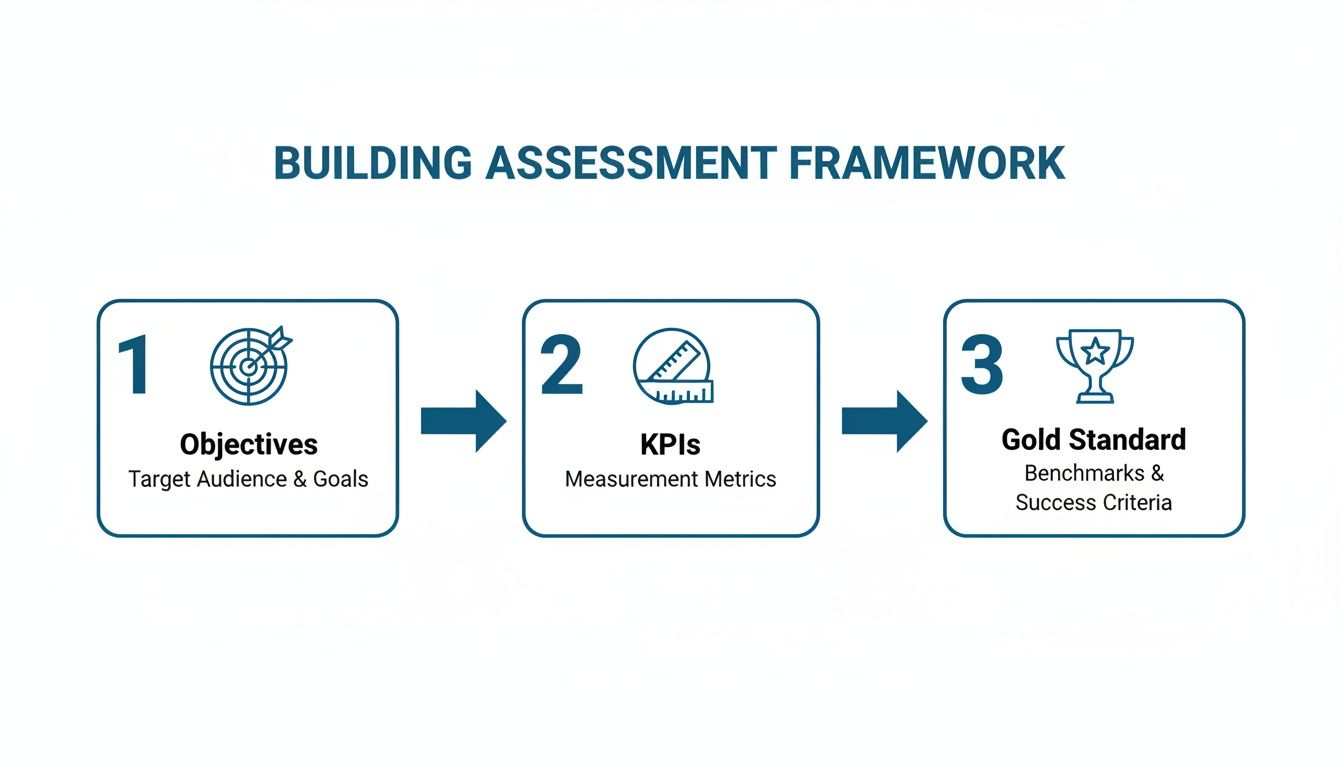
This flow makes it clear: a successful assessment begins by defining your objectives and KPIs, which then helps you establish a gold standard to guide the entire QA process.
The Adjudication Workflow as a Feedback Loop
So what happens when consensus reviews or audits find a disagreement? The answer is a formal adjudication workflow. This is just a structured process for resolving conflicting labels and making the final call.
Typically, a senior annotator or a subject matter expert steps in as the adjudicator. They review the disputed label, look at the different annotations provided, and consult the gold standard document to decide on the correct answer. But their job does not stop there.
The real magic of adjudication is its role as a feedback loop. Every single disagreement is a chance to learn and improve.
- Analyze the Root Cause: Was the conflict caused by a fuzzy rule in the guidelines? An unclear example?
- Update the Guidelines: Clarify the rule, add a better visual example, or specifically address the edge case. Check out our detailed guide for more on crafting effective annotation guidelines.
- Retrain the Team: Push the update out to the entire annotation team to make sure the same mistake does not happen again.
This continuous cycle of review, resolve, refine is what separates good data annotation from great data annotation. It systematically wipes out ambiguity, gets your annotators on the same page, and ensures your dataset’s quality actually improves over time. That is how you build a rock-solid foundation for your AI.
Understanding Essential Metrics and Scoring Methods
To get past a simple "good" or "bad" verdict on your data, you need to speak the language of quality: objective metrics. These scoring methods let you quantify performance, track improvements over time, and set clear standards across your teams and vendors. They turn the fuzzy idea of "accuracy" into hard numbers that shape your entire AI strategy.
Sure, basic accuracy is a starting point, but it almost never tells the whole story. To really understand the nuances of your annotation quality, you have to dig a bit deeper.
Core Metrics for Classification and Labeling
For tasks like sentiment analysis or content moderation, a trio of metrics gives you a much clearer picture of what is actually happening. Each one answers a slightly different, but equally critical, question about your labeled data.
These foundational metrics are:
- Precision: This answers, "Of all the items we flagged as X, how many were actually X?" Precision is your go-to metric when the cost of a false positive is high. Think about labeling emails as spam; high precision ensures you are not accidentally hiding important messages in the junk folder.
- Recall: This metric asks, "Of all the true X's that exist, how many did we actually find?" Recall is vital when a false negative is a disaster. In medical imaging, for instance, high recall for tumor detection is non-negotiable. Missing a real case is not an option.
- F1-Score: This metric balances the two by calculating the harmonic mean of precision and recall. It is especially handy when you need a single number to represent performance, particularly if you have an uneven class distribution.
By tracking all three, you get a multi-dimensional view of annotation quality. It allows you to make smart trade-offs based on what matters most for your specific project.
Measuring Consistency with Inter-Annotator Agreement
Even with crystal-clear guidelines, human judgment varies. Inter-Annotator Agreement (IAA) is designed to measure just how consistent your annotators are when labeling the same piece of data. It tells you if your team is aligned and if your instructions are as unambiguous as you think they are.
A popular way to calculate IAA is with Cohen's Kappa. What makes it so effective is that it does not just measure agreement; it accounts for the possibility that annotators might agree purely by chance. A high Kappa score (typically >0.80) signals strong, reliable agreement, proving your annotation process is robust and repeatable.
A strong IAA score is more than a quality metric; it is a direct reflection of your operational excellence. It proves that your guidelines, training, and QA processes are working in harmony to produce consistent, trustworthy data.
Scoring Metrics for Computer Vision
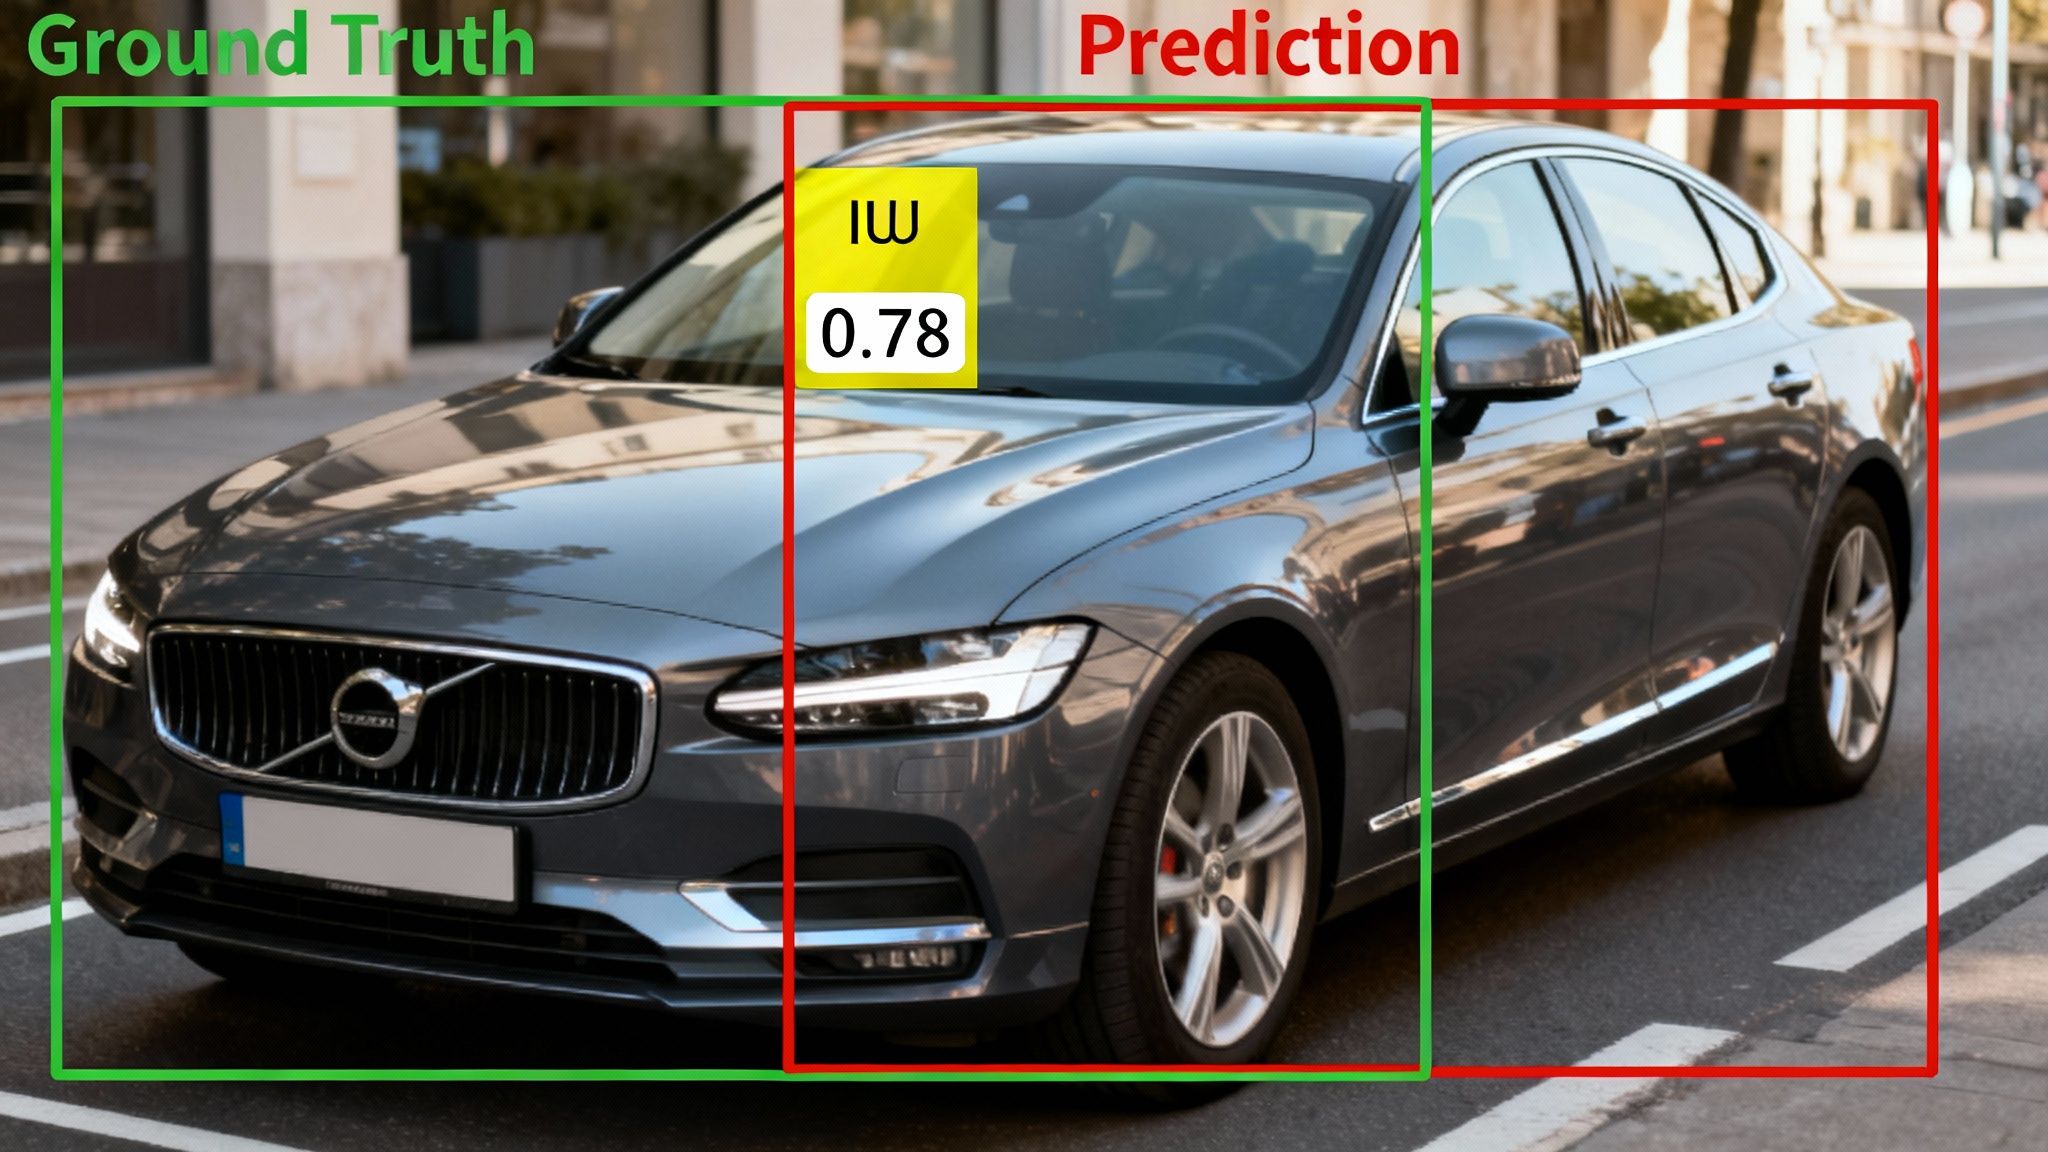
Computer vision tasks like object detection need specialized metrics that can evaluate spatial accuracy. The undisputed king here is Intersection over Union (IoU). IoU measures the overlap between the annotator's predicted bounding box and the ground truth (the correct label).
The score is simple: divide the area of overlap by the total area of union between the two boxes. A score of 1.0 is a perfect match, while 0 means no overlap at all. In the automotive industry, an IoU score above 0.8 is often the gold standard for detecting pedestrians or other vehicles. That level of precision is absolutely critical for building safe autonomous systems.
In fact, the image and video annotation market, which makes up 41.6% of the industry, depends heavily on high IoU scores. Hitting these targets can slash false positives in object detection models by as much as 28%, making it a vital KPI. You can read more about how these metrics drive industry standards in the data labeling and annotation tools market report. These metrics are fundamental to any effective data annotation assessment.
Turning Error Analysis into Actionable Improvements
Finding an annotation error is just the first step. The real breakthrough happens when you figure out why it happened and use that knowledge to stop it from happening again. This shifts your assessment from a simple audit to a powerful engine for continuous improvement, directly lifting the quality of your training data and your AI model’s performance.
Playing whack-a-mole with mistakes is a losing game. It is slow, inefficient, and never gets to the heart of the problem. A much better approach is to systematically analyze error patterns to find the weak spots in your entire workflow. This lets you move from just reacting to problems to proactively building a stronger, more accurate annotation process from the ground up.
Building an Error Taxonomy
Your first move is to create an error taxonomy, a structured system for classifying every single mistake your QA team catches. Instead of just marking something as "wrong," you give it a specific category. Suddenly, a messy list of individual slip-ups transforms into a clean, analyzable dataset of your own.
A solid error taxonomy might include categories like:
- Incorrect Label: The classic mistake of assigning the wrong class (e.g., labeling a truck as a car).
- Missed Object: Failing to label an object that should have been annotated.
- Boundary Inaccuracy: Drawing a bounding box that is either too sloppy and loose or unhelpfully tight.
- Attribute Error: Getting a specific detail wrong (e.g., labeling a vehicle’s color as blue when it is green).
- Guideline Misinterpretation: The label is technically correct but violates a specific rule documented in the project guidelines.
This simple classification system makes patterns jump out at you. If you see a sudden spike in "Boundary Inaccuracy," you know to investigate whether a recent guideline change or a new tool feature is tripping up your team.
Performing Root Cause Analysis
Once your errors are neatly categorized, it is time for root cause analysis. This is where you put on your detective hat and dig deeper. Was the error a one-off human mistake, or is it a symptom of a much bigger issue?
A thorough root cause analysis separates the 'what' from the 'why.' It helps distinguish between an annotator's knowledge gap and a flaw in the system, ensuring your remediation efforts are targeted and effective.
The goal is to figure out if the problem falls into one of three main buckets:
- People: Does a single annotator or a whole group need more training on a very specific task?
- Process: Are your annotation guidelines vague, contradictory, or missing clear examples for tricky edge cases?
- Platform: Is the annotation tool clunky, slow, or missing a feature that would make accurate labeling way easier?
For example, a high rate of "Missed Object" errors on small items might not be the annotators' fault. The real culprit could be a tool that does not have a good enough zoom function, making those objects nearly impossible to spot and label correctly.
Creating Practical Remediation Workflows
With a clear picture of the root cause, you can finally implement targeted remediation workflows. This is how your data annotation assessment becomes a collaborative tool for growth, not just a grading exercise. A structured approach guarantees that every problem you find leads to a concrete, positive change.
Here’s a simple framework for putting this analysis into action.
Example Error Taxonomy and Remediation Workflow
This table breaks down how to connect a specific error category to its most likely cause and the best way to fix it for good.
| Error Category | Example Error | Potential Root Cause | Recommended Remediation Action |
|---|---|---|---|
| Guideline Misinterpretation | Annotators consistently mislabeling "partially occluded pedestrians." | The "occlusion" rule in the guidelines is vague and lacks clear visual examples. | Update the gold standard document with specific "do" and "don't" image examples. |
| Incorrect Label | A new annotator frequently confuses two similar product categories. | Insufficient initial training and a gap in domain knowledge for this specific task. | Create a targeted micro-training module focused on differentiating these categories. |
| Boundary Inaccuracy | Multiple annotators are creating bounding boxes that are too large. | A recent software update changed the tool's snapping behavior, making precision difficult. | Escalate the issue to the platform provider and provide temporary workaround instructions. |
| Attribute Error | Annotators in a specific batch mislabeled the "sentiment" attribute in text. | The task instructions for that batch were unclear or copied incorrectly. | Correct the batch instructions and reprocess the affected data with the clarified rules. |
By adopting this systematic approach, you create a powerful feedback loop. The insights from your data annotation assessment directly fuel improvements in training, guideline clarity, and tooling. This virtuous cycle steadily drives down error rates, sharpens annotator performance, and ensures your AI model is built on a foundation of truly exceptional data.
Weaving Assessment into Your AI Development Lifecycle
High-quality data annotation is not something you check for at the end. An effective assessment process should be woven into the very fabric of your AI development lifecycle, not treated as a final inspection before model training begins.
When you treat quality as a continuous, integrated process, you catch issues early, sidestep expensive rework, and build your model on a foundation of trust from day one. Waiting until the end is just a recipe for blown budgets and missed deadlines. Think of it as a system of early warnings that keeps quality front and center, never an afterthought.
Validate Feasibility with Pilot Assessments
Before you commit to annotating a massive dataset, a pilot assessment is your best friend. This is a small-scale, preliminary annotation project designed to put your entire setup to the test. It is like a dress rehearsal that validates your guidelines, tooling, and team readiness before you scale up.
During a pilot, you can get answers to critical questions:
- Are your annotation guidelines clear and unambiguous, or are they creating confusion?
- Is the annotation platform you chose actually efficient for this specific task?
- What is a realistic baseline for annotator speed and initial accuracy?
This initial assessment provides invaluable early feedback. If your pilot reveals a high disagreement rate between annotators, you know your guidelines need immediate work, before you waste resources labeling thousands of data points the wrong way.
Use Real-Time Dashboards for Proactive Monitoring
Once your project is in full swing, waiting around for weekly or monthly quality reports is far too slow. Modern annotation workflows depend on real-time quality dashboards. These visual tools track your key performance indicators (KPIs) as they happen, giving you an immediate pulse on the health of your entire data pipeline.
A real-time dashboard transforms quality assessment from a reactive audit into a proactive management tool. It empowers teams to spot negative trends instantly and intervene before minor issues cascade into major dataset failures.
Imagine a dashboard showing a sudden drop in an annotator's accuracy score or a spike in the adjudication rate for a particular batch. This lets a manager step in immediately, provide targeted feedback, and fix the problem before it contaminates a large volume of data.
Connecting Annotation Quality Directly to Model Performance
Ultimately, the goal of any data annotation assessment is to build a better AI model. The most powerful practice here is to correlate annotation quality metrics with model performance. This means systematically connecting specific error types you find during assessment to specific failures you see in your model’s output.
For example, you might discover your object detection model struggles to identify "partially occluded vehicles." By tracing this back, you find that your "occlusion" annotation rule was applied inconsistently. This direct link tells you exactly where to focus your data correction efforts to get the biggest bang for your buck. This is a core principle behind our expert data annotation services.
This final step closes the loop, turning your assessment process into a strategic driver of model improvement. By prioritizing fixes that target known model weaknesses, you ensure every hour spent on QA delivers measurable, significant gains.
Answering Your Top Questions About Data Annotation Assessment
As you start building a formal assessment process, you are bound to run into a few practical questions. This is where the theory meets the road. Let's tackle some of the most common ones to help you move forward with confidence and build a rock-solid AI development workflow.
What Is a Good Inter-Annotator Agreement Score?
Everyone wants to know the magic number for a "good" Inter-Annotator Agreement (IAA) score. While there is no single answer, we can look at some solid benchmarks. We typically measure this with metrics like Cohen's Kappa, which tells us how consistent our annotators are with each other.
Here is a practical breakdown:
- Substantial Agreement: A score between 0.61 and 0.80 is generally considered strong. It means your annotators are seeing things the same way most of the time, and your guidelines are holding up well.
- Almost Perfect Agreement: Anything over 0.81 is fantastic. For high-stakes applications like medical imaging or financial fraud detection, you should be pushing for the highest score possible, often >0.85.
But remember, context is king. If you are working on something highly subjective, like nuanced sentiment analysis, a score closer to 0.70 might be a perfectly realistic and acceptable target.
How Do I Choose the Right Sampling Size for Quality Review?
Picking the right sample size for your quality review is a classic balancing act. You need to review enough data to catch real problems without bringing your entire project to a standstill.
A 5% to 10% random sample of each annotated batch is a great starting point. If that initial check flags a high error rate, it is time to dig deeper. You might increase the sample size for that specific batch or, if the quality is really poor, move to a 100% review.
For mature projects where your team has a track record of delivering clean, consistent data, you can often dial back the sample size. The goal is to let real-time quality data guide your efforts, focusing your review power where it's needed most.
Should We Build Assessment Tools or Use a Platform?
For almost every team out there, using a data annotation platform with built-in assessment tools is the smarter, more scalable choice. These platforms come out-of-the-box with QA workflows, live performance dashboards, and automated analytics to track everything from IAA to individual annotator accuracy.
Going the custom route and building your own assessment solution is a massive engineering project. It takes significant resources to develop and even more to maintain. A dedicated platform frees up your team to focus on what really matters: defining quality standards and analyzing results, not debugging infrastructure.
Ready to build a data annotation assessment framework that drives real-world AI performance? The experts at Prudent Partners LLP can help you design and implement a multi-layered QA process tailored to your specific needs, ensuring your models are built on a foundation of accuracy and trust. Connect with us today to start your customized pilot project.