
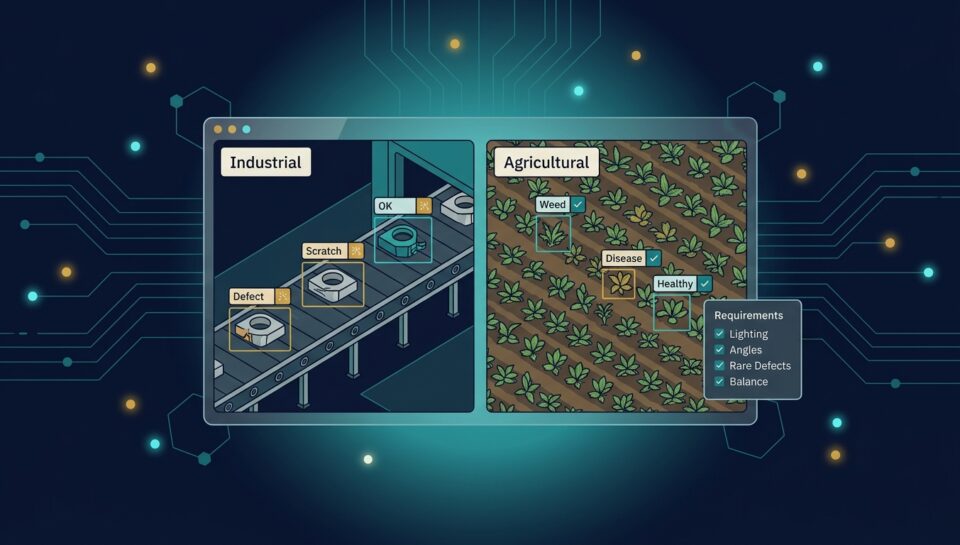
Computer vision arrived in factories and fields later than in consumer applications, and it is now spreading quickly: defect detection on production lines, equipment condition monitoring, crop health assessment, livestock monitoring, and yield estimation. These deployments share a set of data problems that differ meaningfully from the ones consumer computer vision solved, and teams that approach them with consumer assumptions tend to build models that demo well and fail on the line. This guide covers what industrial and agricultural computer vision actually needs from its data.
The Defining Problem: Extreme Class Imbalance
In most industrial inspection, the thing you want to detect is rare. A well-run production line produces defects in a small fraction of output, which means a naturally collected dataset contains overwhelmingly normal examples and very few defective ones.
This has consequences that catch teams out. A model can achieve very high accuracy by predicting "normal" almost always, which is useless. The rare defect types, often the most consequential ones, may have only a handful of examples. And ordinary accuracy metrics conceal the problem entirely, which is why evaluation in this domain has to focus on performance on the rare class specifically.
The practical responses are deliberate over-collection of defective examples over time, careful use of augmentation and synthetic generation for rare defect types, and evaluation designed around the rare class rather than aggregate accuracy. It also means production data collection has to be planned from the start, because defect examples accumulate slowly and cannot be created retrospectively.
Conditions Are Not Controlled
Consumer computer vision benefits from images taken by people trying to take good images. Industrial and agricultural imagery is captured by fixed cameras and drones under whatever conditions exist.
In manufacturing that means variable lighting, vibration, dust, reflective and transparent surfaces, and parts presented at inconsistent orientations. In agriculture it means sun angle changing through the day, weather, seasonal appearance shifts, occlusion by other plants, mud, and dramatic differences between growth stages of the same crop.
A dataset that does not span these conditions produces a model that works in the conditions it saw. This is the single most common cause of a pilot that succeeds and a deployment that does not, because pilots are usually run in favourable conditions.
Defining the Label Is Harder Than Applying It
In both sectors, the hard question is often what counts.
A scratch is a defect at some length and depth and not below it, and that threshold is a business decision informed by engineering rather than something an annotator can infer. Crop disease severity exists on a continuum that has to be divided into categories somewhere. Wear on a component is progressive, and where inspection-worthy begins is a judgment.
This means the annotation guideline is really a specification of the business rule, and getting it wrong produces a model that is consistent with the wrong standard. Practically, guideline development in these domains needs the people who currently make these judgments, quality engineers or agronomists, and it usually needs several rounds of worked examples on genuinely marginal cases before it stabilises. Ourannotation quality guide covers measuring whether the guideline is applicable, which in these domains is the fastest way to discover that the threshold was never actually agreed.
What Gets Annotated
Defect detection and classification. Location and type, often with severity, on manufactured items.
Segmentation for measurement. Where the model must quantify area, length, or coverage rather than detect presence, which applies to both surface defects and crop coverage.
Condition and severity grading. Ordinal categories along a continuum, used for equipment wear and crop disease alike, and the category where inter-annotator disagreement is highest.
Counting. Objects, plants, or animals, frequently at density where occlusion makes exact counting genuinely ambiguous.
Anomaly framing. For situations where defect types cannot be enumerated in advance, annotation focuses on labeling normal thoroughly so departures can be flagged.
Ourimage annotation andvideo annotation capabilities cover the underlying work.
Domain Knowledge Is Not Optional
A general annotator can mark an obvious defect. Distinguishing a cosmetic blemish from a structural flaw, or nutrient deficiency from early disease, requires knowing the domain. In both sectors the distinctions that matter commercially are frequently the ones that look similar visually.
The workable model is the layered one used in other specialist domains: domain experts define the scheme and adjudicate hard cases, trained annotators handle volume against detailed guidelines with worked examples, and a meaningful sample receives expert review with disagreement tracked to catch drift.
Deployment Reality Shapes the Data
Two deployment constraints feed back into data requirements. Many of these systems run at the edge, on limited hardware near the camera, which constrains model size and therefore how much the model can learn, which raises the premium on data quality over quantity. And inspection often has to keep pace with a production line, which means the operating point is chosen for latency as well as accuracy, and evaluation should reflect the operating point that will actually be used.
The Ongoing Requirement
Neither domain is static. Manufacturing changes products, tooling, and materials. Agriculture faces new pest and disease pressures and varies year to year. Both mean the model drifts unless data collection continues after deployment, with new defect types and conditions folded back into training and evaluation. OurAI quality assurance function covers this monitoring discipline.
Common Questions From Industrial and Agricultural Teams
Why is class imbalance such a problem in inspection AI?
Because defects are rare, so a naturally collected dataset is overwhelmingly normal examples. A model can score high accuracy by rarely predicting defect, and aggregate metrics conceal poor performance on exactly the class that matters.
How do you get enough defect examples?
Through deliberate over-collection of defective items over time, careful augmentation or synthetic generation for the rarest types, and planning production data collection from the start, since examples accumulate slowly.
Why do inspection pilots succeed and deployments fail?
Usually because the pilot ran in favourable conditions. Real lighting, vibration, dust, weather, and seasonal variation are absent from the pilot dataset, so the model never learned them.
Who should define what counts as a defect?
The people who currently make that judgment, typically quality engineers or agronomists. The annotation guideline is really a specification of the business rule, and annotators cannot infer the threshold.
What makes agricultural imagery difficult?
Sun angle and weather variation, occlusion by surrounding plants, dramatic appearance changes across growth stages, and disease or deficiency categories that sit on a continuum rather than in discrete classes.
How is severity grading annotated consistently?
With ordinal categories defined by worked examples on marginal cases, and measured disagreement between annotators, since severity is where inter-annotator disagreement is consistently highest.
Does edge deployment change data requirements?
Yes. Limited hardware constrains model size, which raises the premium on data quality over volume, and evaluation should reflect the latency-constrained operating point the system will actually run at.
Does data collection stop after deployment?
It should not. Products, materials, pests, and seasons all change, so new conditions and defect types need to flow back into training and evaluation or the model drifts.
Working With Prudent Partners
Prudent Partners Private Limited prepares computer vision training data for industrial and agricultural applications: defect detection and classification, segmentation for measurement, severity grading with measured consistency, and counting under occlusion, with guideline development run alongside your domain experts so the labels encode your actual standard. See ourimage annotation andvideo annotation capabilities.
The first conversation is a 30-minute scoping call about what you are detecting, the conditions it runs in, and how the standard is currently judged. No commitment to go further.